|
The Grade 8 Geography curriculum focuses on the study of Human Geography.
This means we will be exploring topics related to populations, development and sustainable communities. |
|
Upcoming Deadlines:
|
|
Unit 2 Topics to be Tested On
Here is a list of the topics that have been covered and will be tested on in the upcoming test. We completed a review of most concepts on January 7th, so if students are still feeling unsure of these topics, they should be using the resources here to review, asking for help and using Student Success during 2nd lunch to catch up. |
|
Test Review Questions
| ||
|
Economic Sectors
In class, students had to try and list as many jobs as they possibly could. Afterwards, they were given a definition for 4 sectors of the economy and had to work with their partner to divide the jobs that they brainstormed into the appropriate sector. If you click on the SECTORS OF THE ECONOMY BUTTON, it will take you to a great article that explains each sector clearly and would be an excellent review. |
| ||
|
Population Pyramids
Here is the Powerpoint used in class to review key information about interpreting population pyramids and to prompt discussion. |
| ||
|
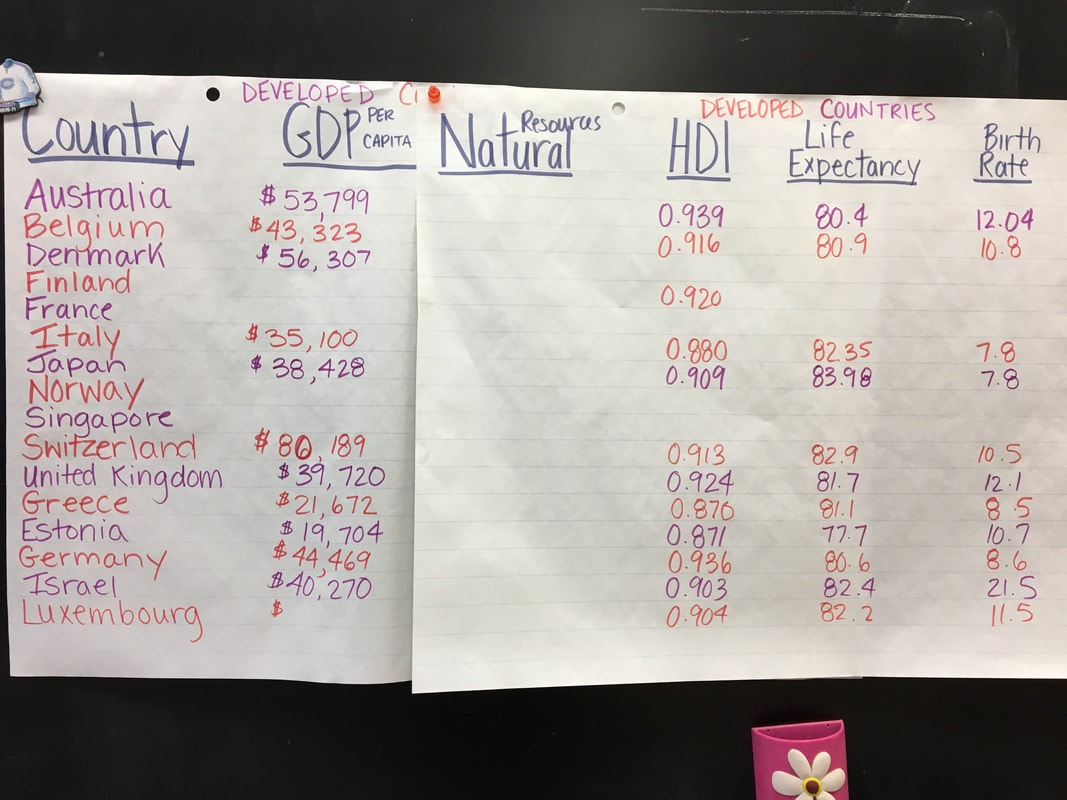
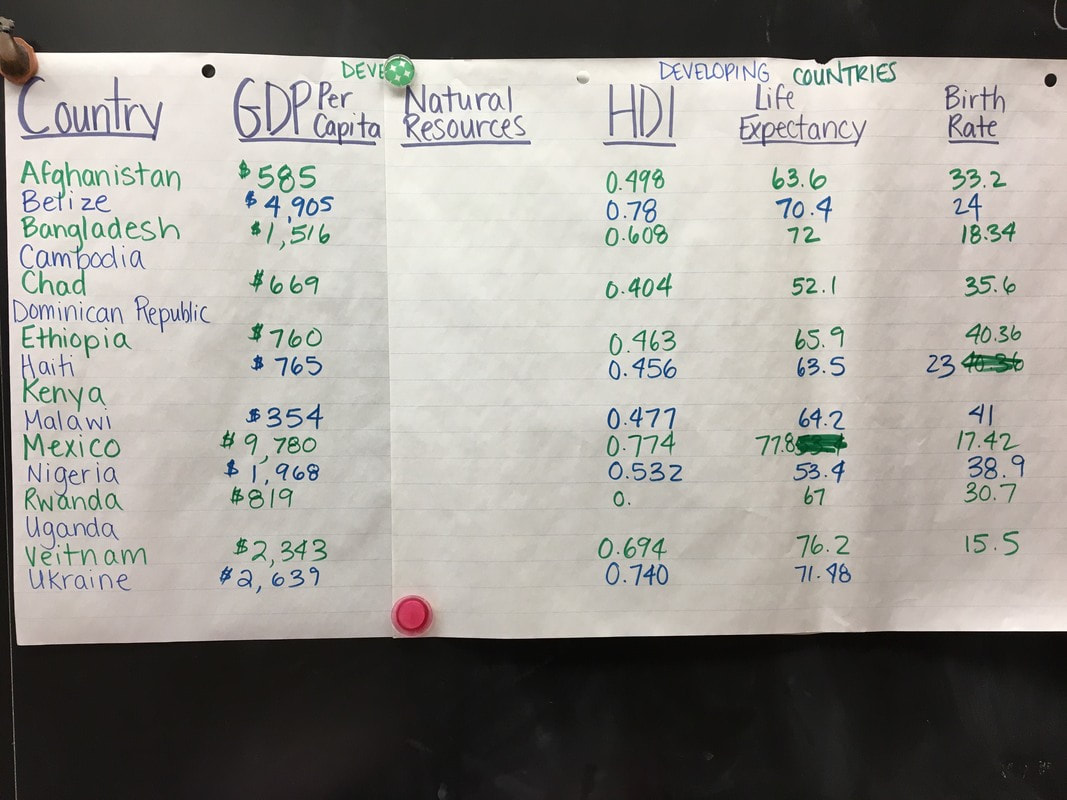
What's the difference between Developed and Developing Countries?
In this activity, students were matched with a partner and were expected to research specific qualities of both a developed and developing country in order to compare these features and draw conclusions as to what is different between these types of countries. Here is a summary of the major differences found: |
| ||
|
|
|
Wealth & GDP
Here is the Powerpoint presentation that was used to introduce and discuss new terms related to wealth, GDP and the economy. Students then analyzed an image of the world GDP to determine which 10 countries had the strongest economies. This image is from an article on foreignpolicy.com. Clicking on the button will bring you to the original article. |
| ||||
|
World Happiness Report - Scatter Graph Assignment
|
| ||
|
The assignment, the raw data for the assignment and a step-by-step review of how to create scatter graphs in Excel are all available here:
Final answers should be typed into the text boxes on the assignment sheet and then emailed to Ms. H once completed. |
| ||||
|
| ||||
|
Scatter Graphs - Learning Activity
Scatter Graphs are graphs that allow you to visually see correlations between 2 independent variables. We are learning how to create and interpret them. The Excel file that we will use for this learning activity is attached. The PowerPoint file that we used to learn about these graphs is also attached. |
| ||||
|
Land Use Assignment - Carleton Place Case Study
The assignment outline is attached here. Use Google maps (satellite option) to analyse Carleton Place and create a land use map highlighting major areas of each type of land use. Remember to include a Legend & Title. |
| ||||
